By Aths Idiot Matt Lynch
Where the bloody hell do we begin?
In a new world full of point scores, raw scores, wind adjustments, bonus points and competition categories, the new qualifying system for Tokyo2020 has split the Track and Field world. This guide will aim to hopefully lead you through the ranking’s wilderness and out the other side with a clearer vision of what it’s all about.
Before we even begin to dive deep into this cavern of mystery every Australian athlete should have the most recent copy of the IAAF point score table. If you don’t, you’re already a step behind.
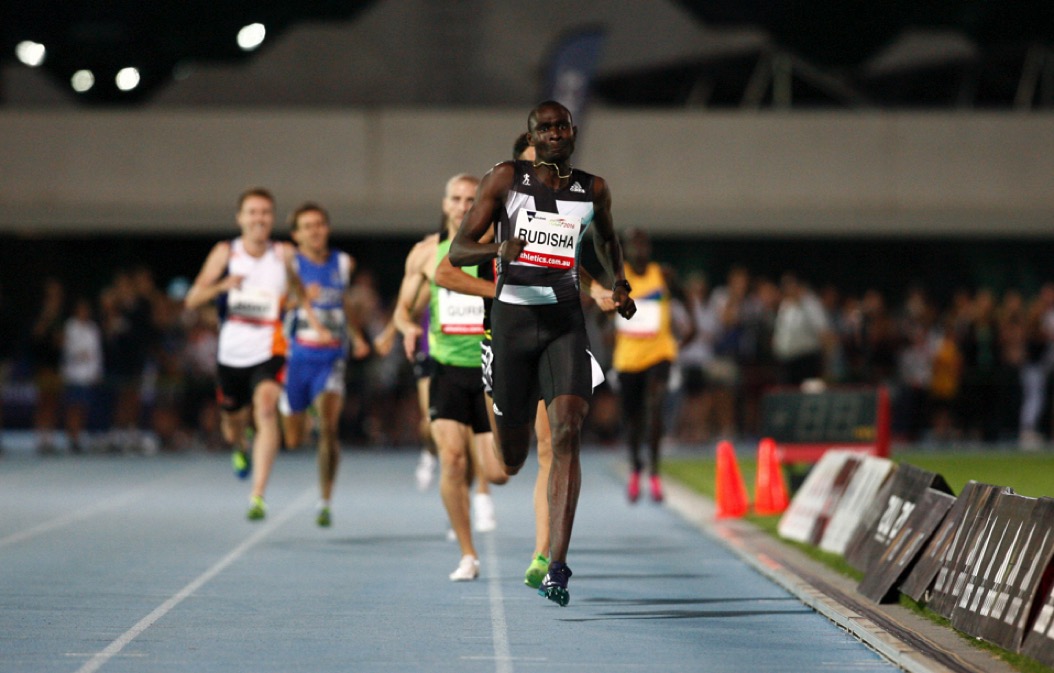
Never fear though. Head here and scroll down to scoring tables. If you download the one with Rudisha on the cover, then we’re in business! (download the indoor one as well. We’ll come back around to that one later).
 If you’ve been pretty intimate with the point score table, definitely skip ahead, but if not, sharpen your pencils and start taking notes.
A few notes on the IAAF point score table:
- Only for open specs.
- Used to compare events within the same gender, not for events across genders
- Should a performance fall between two results on the tables, the lower score shall be considered.
- Scores run from 1400 points to 1 point.
Men’s 100m example: 1400 points = 9.46s, 1 point = 16.76s
________________________________________________________________________
Point score example
If a male 100m athlete runs 10.03s, they receive 1196 points. The same points would be awarded to an athlete who ran a 13.30 110h, a 20.15 200m or a 44.77 400m.
As with the dot points above:
Should an athlete performance fall between two results on the table, the lower score shall be considered
A male 400m runner who runs 44.76 won’t find their performance on the table, so they receive the lower score equal to the 44.77
 _____________________________________________________________
The document after this is pretty simple. It’s 370 pages of numbers split into genders and event groups for easy comparison:
- Sprints, Hurdles and Relays
- Middle Distances
- Long Distances and Steeplechase
- Road Running
- Race Walking
- Jumping and Throwing events and Decathlon/Heptathlon
You don’t need to memorise this or be a master of point scores, you just need to know how to use the document and where to look. Simples.
____________________________________
IAAF Ranking System
This is where you’ve skipped to if you were already well versed in the point score table. Hell, you can skip the whole thing if you’ve got this system down pat, but if your still unsure, let’s get deeper.
The IAAF Ranking system is based off the below calculation:
PERFORMANCE SCORE = RESULT SCORE + PLACING SCORE
Basically;
Result score: Your time/distance (converted into a point score using the table that you’ve now already downloaded before reading this far)
+
Placing score: The place you came at your event (hopefully first, but we can’t all be winners)
=
Your Performance Score.
Now there’s a few extra tweaks in this that affect both your results score and placing score. Events that require wind readings (100, 200, 100H, 110H, LJ and TJ) are included and modified to include bulk tailies and bulk headies.
All runs completed under 0.0 to +2.0 wind conditions do not alter your Result Score. A 200m run of 24.00 will receive the same Result Score if it was done with a +0.3 or a +1.9. once we start working towards headwinds and illegal tailwinds, the pluses and minuses really come into action. With the new IAAF rankings system, performances under all conditions can be ranked.
The table below is what is being used for the wind adjustments:
| Tailwind | Headwind | ||
| + 4 | -24 | -4 | +24 |
| + 3 | -18 | -3 | +18 |
| + 2 | 0 | -2 | +12 |
| + 1 | 0 | -1 | +6 |
For wind readings in between those in the table above, the allocation of points is ±0.6 points for every ±0.1 of wind.
If there’s no wind information in the results (NWI) then 30 points are deducted from the score.
Let’s use Jack Hale as an example. Jack has had a ripper 2019, re-setting his personal best twice. He’s also been the victim of some solid tailwinds. Let’s have a look at some of his performances over the last few years:
| Meet | Time | Pure time Score | Wind | Wind +/- | Result Score |
| QLD Track Classic 2019 | 10.19 | 1142 | +2.0 | 0 | 1142 |
| WA State Champs 2019 | 10.12 | 1165 | +3.0 | -18 | 1147 |
| 2019 Aus champs final | 10.34 | 1092 | -0.2 | +1 | 1093 |
| Jandakot Track Classic 2018 | 10.10 | 1172 | +2.1 | -12 | 1160 |
We’ll start with the easy one. Hale’s pb run of 10.19 was with a +2.0 (the perfect wind because QLD always delivers) doesn’t change because the wind was within the legal limits.

Hale’s 10.12 from the WA Championships however was done with a +3.0. The IAAF states a +3 tailwind requires a deduction of 18 points from the Pure time score (I made up this term). It still ends up being worth more than the wind legal 10.19 but athletes need to take full advantage of wind conditions.
In the National championships final, there was a slight headwind (-0.2) which resulted in Hale’s Pure time score gaining a single extra point, going from 1092 to 1093.
See, headwinds aren’t all bad.
The thing that really gets my goat is the huuuuuuuuuuge disadvantage of a +2.1. Its already the single most-evil wind reading on the planet, but now with the points deduction, you lose a full 12 points off your result score for this wind. See Hales 10.10 performance at the Jandakot Airport Track Classic back in 2018. At 10.10 by itself receives a pure time score of 1172 but take into account the +2.1 and you’re left with an 1160 score for your efforts. What I can gather from this is that the points deduction starts accruing from 0 but only comes into play when the wind becomes illegal (+2.1).
Only now are we starting to see the huge advantages of a bulk tailwind. The best and most recent example of this is Kenny Bednarek. The 21-year-old, with the assistance of a +6.1 hurricane, dropped a 19.49, the 4th fastest time ever recorded under any conditions.
A pure point score for a 19.49 is 1302. A ridiculous score. Huge.
Now we have to take the wind into account. A +6.1 comes with a deduction of 36 points. 6 points for every +1.0m of wind. This leaves Kenny with a Result Score of 1266.
Now it sounds like Kenny has been disadvantaged by this deduction. But on the contrary, a 1266 equates to a time of 19.71! This was done in the heats of the NJCAA DIV1 championships, so there was no placing score for his time, so was just left with a 1266. Imagine this was done at an A Category Competition, with 140 bonus points for the win, his score would have shot through the roof.
Kenny was coming into these championships with a Personal Best of 20.29 only a few weeks before, so the huge tailwind really helped get that score on the rise.
To again put it into perspective, he backed up his ridiculous heat with a legal 19.82 with a -0.8. This gave Kenny a pure performance score of 1248 for the 19.82 and and additional 4.8 points for the negative wind (0.6 points for every -0.1 of wind) Everything seems to be rounded down, so an addition of 4 points to his 1248 gave him a Result Score of 1252. As this was a final, Kenny received 15 Placing Points for the victory, giving him a Performance Score of 1267.
These two runs, on back to back days gave Kenny a 1266 and a 1267 that go towards his five performances towards Tokyo (obviously doesn’t need the ranking as 19.82 is well below to Tokyo qual but it’s a good example)
It also shows the power of the wind, given that his heat score was only beaten by a single point on his finals score that had extra points for the negative wind and first place.
Thankfully all the calculations are done for you but it’s good to be aware of what’s happening in the world.
Now it’s time to move onto some field events, in particular, the Long Jump and Triple Jump. In the case of these field events, an athlete can have two different measurements both count towards their overall performance score.
As per the IAAF
“In Long Jump and Triple Jump, if the final result is wind-aided, then the best legal jump of the athlete (a performance with wind less than or equal to 2.0 m/s) can be considered as the Result Score, should it give better Result Score to the athlete after the wind modification applied to it.”
We’ll use this made up long jump result as an example. To help with this example, we’ll say this was at the QLD Track Classic (B level meet) with 100 points for first.
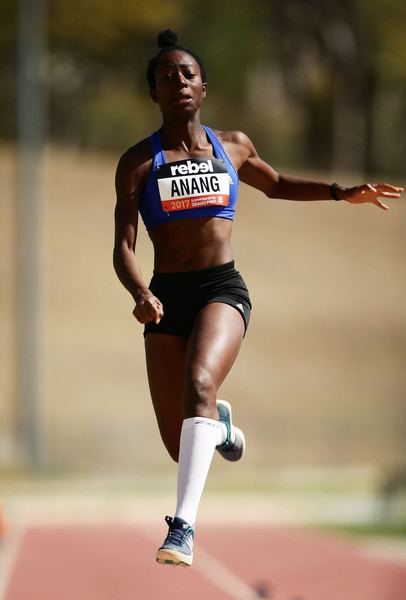
| Naa Anang | 6.50 | 6.55 | 6.70 | 6.73 | 6.42 | x |
| Wind | 0.8 | 1.2 | 1.4 | 2.1 | 1.7 | 0.9 |
 In this imaginary competition, Naa has taken out the win with a wind assisted jump of 6.73m. Congrats! A leap of 6.73m is worth 1158 points. Add that with the 100 bonus points and you’ve got a Performance Score of 1258. Not too shabby. The issue here, is that because of the 2.1 wind, we need to take some points away, 12 points to be exact, leaving Naa a final score of 1246.
This is perfect example of a wind legal jump giving a better Performance Score. Naa’s third round jump of 6.70m receives a score of 1152, and without and wind adjustment reductions, and the 100 point Placing Score on top, she is left with a Performance Score of 1252.
In this case, the wind assisted 6.73 helped Naa achieve first place and the 100 Placing Points, but because her 6.70 gave her a better Result Score after the wind adjustments, that effort is what is used to record her Performance Score.
Part 2 probably coming soon…


